Real Estate Infographics
Data Visualization Guide
By: Cate Brown
Read Time: 3 Minutes

Get ready to embark on an exciting adventure as we dive into the dynamic world of infographics. These essential tools can transform your blog content into visually stunning narratives that captivate and engage your readers. Together, we'll explore how to communicate complex data in an informative and fun way. So, let's unleash our creativity and embark on this colorful data visualization journey!
Leveraging Infographics for Market Insights
As a real estate professional, keeping up with market trends, statistics, and insights is crucial. And what better way to share this wealth of information with your audience than through the power of infographics? Infographics are a potent tool that can help you communicate complex data in an engaging and visually appealing way.
From showcasing housing price trends to illustrating the benefits of living in a particular neighborhood, infographics can pack a punch by combining data and design. This will guide you through cherry-picking the most pertinent data and crafting it into an informative storyline that speaks volumes through a visually engaging infographic.
By the end of this journey, you will be furnished with the skillfulness and knowledge to create infographics that captivate and inspire your readers. So, let's dive into the world of infographics and unleash the power of data visualization in the real estate industry!

Choosing the Right Infographic Templates for Real Estate Data
Understanding the housing market and the data that comes with it can often feel like unraveling a complex puzzle. But thankfully, there's a powerful tool that can help you make sense of it all:
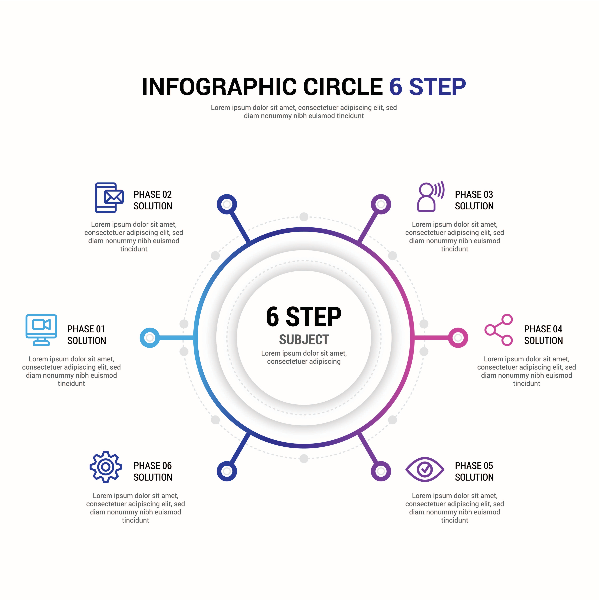
Infographic templates!? Infographic templates can aid in breaking down intricate data into a format that's visually appealing and easy to comprehend. In this segment, we'll introduce you to various infographic templates designed to help you present multifaceted data in a visually structured manner.
Whether through timelines, flow charts, or comparison graphs, we'll guide you through choosing the suitable template that suits the data you're working with.
We'll share tips on transforming complex information into a compelling, seamless visual story. By the end of this segment, you'll be able to create infographics that are not only informative but also visually stunning. So, let's dive into the world of infographic templates and discover how they can help you make the most of your data!
Secrets to Designing Shareable Real Estate Infographics
What makes an infographic stand out is its ability to grab attention and urge viewers to share it across their networks. In this part of our chapter, we'll delve deep into the art of designing infographics that are not only visually pleasing but also shareable.
We'll explore how to play with colors to evoke emotions, the role of typography in enhancing readability, and the importance of creating a balanced layout that guides the eye naturally from one point to another. Additionally, we'll share tips on how to add that "shareable" factor to your infographics, encouraging readers to spread the word and amplify your brand's reach.
We'll also discuss the different types of infographics, from static to interactive ones, and how to choose the best format for your data. We'll cover the dos and don'ts of designing infographics, including using data visualization best practices, such as creating a clear hierarchy and minimizing clutter.
You'll be equipped with the knowledge and skills to design infographics that look great and resonate with your audience. So, let's dive into infographic design and explore how to create shareable content that drives engagement and boosts your brand's visibility!
We hope you're feeling inspired to embrace the world of infographic templates. This is a realm where data meets design, and together, they create informative, visually delightful, and incredibly shareable content.
So, gear up to dazzle your readers with infographics that are not just pictures but narratives that offer a rich tapestry of information through a kaleidoscope of colors and design. Remember, a well-crafted infographic can be a game-changer, transforming your blog from good to extraordinary.
And as you embark on this colorful data visualization journey, remember that the possibilities are endless. Infographics can tell stories, spark emotions, and inspire change.
So, let's celebrate the art of infographics and the impact they can have on your audience. Happy blogging, and here's to creating infographics that tell a story worth sharing!


